
What is an infographic?
Well, its in the name information + graphic. The goal is to simplify complex information and make it visually engaging. To assist in relaying the information in a clean and concise manner.

Here is an example of how to display minerals needed for survival on mars and where on Earth those minerals were found. I used the Periodic Table to display the elements needed to help support the raw components. This was a four page brochure we did in collaboration with USGS.
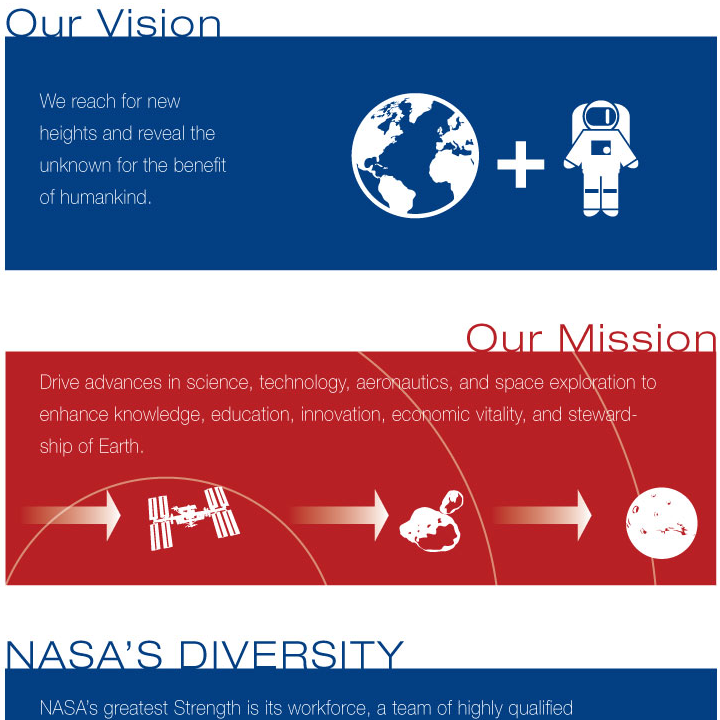
Here are more examples that display facts and figures in an illustrative way. Often used in posters and presentations, but can be used to relay data and comparisons in brochures and proposals.


